Data Entry Tools
(Data Entry and Plotting , Active Table)
Data entry and analysis was largely pushed by Davidson Next physics content, where AP teachers wanted to students to be exposed to data and plotting - note, there are new AP exam questions aimed at this skill.
In addition, we found across all three Davidson Next subjects that teachers wanted "worksheet" style problems that allows students to carry out a series of calculations that would all be graded at once. This functionality is what led to the Active Table problem type.
Data Entry and Plotting
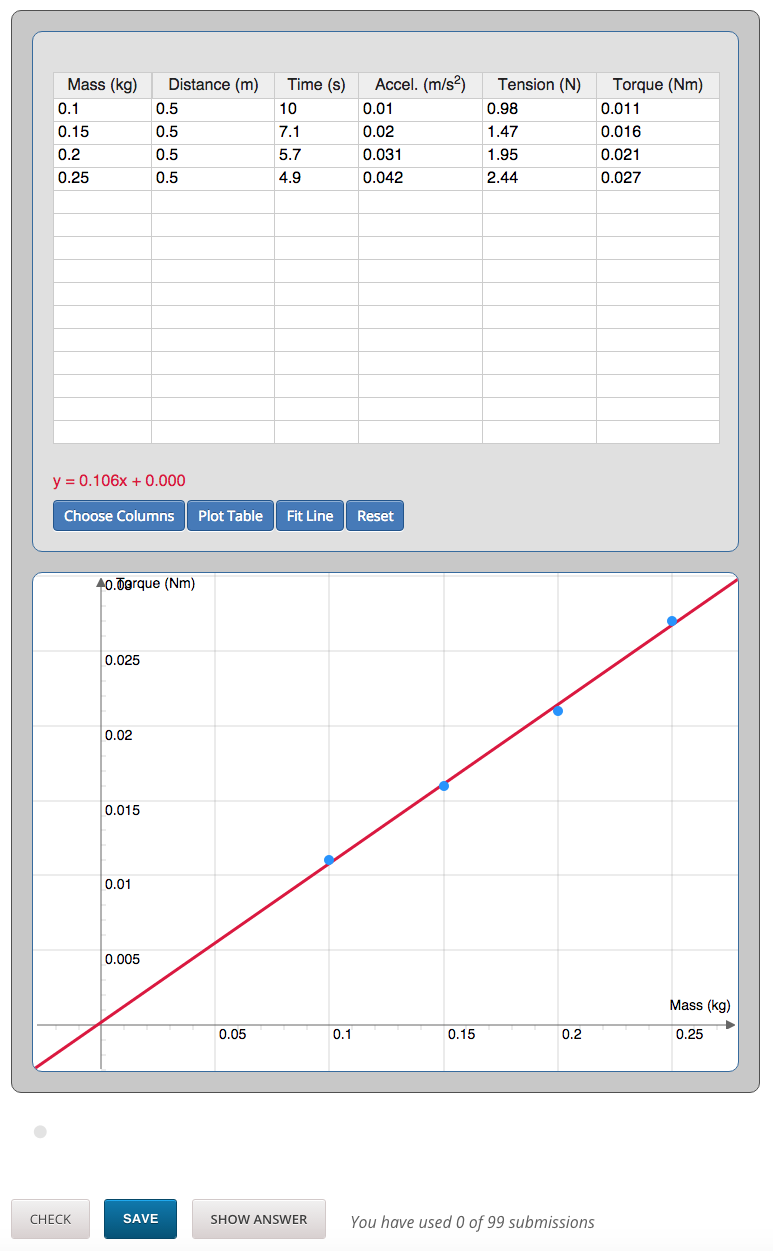
Laboratory activities have been a missing link between online content and AP courses. Our Data Entry and Plotting tool aims to connect online and blended learning courses to a set of tools that allow students to directly store and measure data points within the edX platform.
Instructions.
The general workflow for the Data-Entry and Plotting Tool on the edX Platform:
- In all activities, data will either be prepopulated or there will be empty cells that require calculations. If the latter, simply enter the appropriate data in the cell and hit the "save" button below the app to store it to the system. At this time, the application only accepts decimal notation (i.e., no scientific notation).
- With a complete data table, just choose which columns to plot using the "choose columns" button and drop down menus.
- After selecting the appropriate columns, use the "plot table" button to visualize the data.
- A linear-fit line can be applied to the data by clicking the "fit line" button.
- The linear fit will render "y=m*x+b", where "m" is the slope of the best-fit line, and "b" is the intercept. "y" and "x" represent your selected columns.
- At anytime, you can use the "reset" button to restore all cells to their initial values. This might be necessary if any of the initial values in the table are accidentally overwritten. Important, the reset button will cause you to lose any work you have entered in the data table.
Active Table
edX has miriad of high quality assessment types, but does not yet offer the ability to respond in a table format. Active Table are designed to give instructors control in asking learners to calculate a number of related responses. Right now, this resemble a "worksheet" style problem, where a high school teacher might have a table of values for students to fill out. As we move forward, we hope to expand this tool to allow more "spreadsheet" like activities (for example, one could create a sudoku activity with this problem type). Column and row grading is possible now with custom python grading, but has not been generalized.

Technology
The data entry and plotting tool was largely built around JSXgraph. In addition, modern HTML/Javascript/CSS and JQuery provide some of the refined features of the tool. The Active Table problem type involved more basic HTML components.